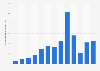
In Chile, there were approximately 13,050 more new houses sold in 2021 than in the previous year. One of the reasons for this drop in home sales in 2020 is the start of the COVID-19 pandemic. There were around 48,320 houses sold in 2020, and 61,370 in 2021. Housing sales in Chile reached a peak in 2015, with roughly 82,380 units sold.
Number of new housing units sold in Chile from 2014 to 2021 (in 1,000s)
Basic Account
Get to know the platform
You only have access to basic statistics.
This statistic is not included in your account.
Starter Account
The ideal entry-level account for individual users
- Instant access to 1m statistics
- Download in XLS, PDF & PNG format
- Detailed references
$199 USD / Month *
Professional Account
Full access
Business Solutions including all features.
* Prices do not include sales tax.
Other statistics that may interest you Statistics on
About the industry
10
- Premium Statistic Chile: new housing unit sales in Greater Santiago, Chile 2014-2021
- Premium Statistic Mexico: housing price in Greater Guadalajara 2013-2021
- Premium Statistic Mexico: housing price in selected metropolitan areas 2017-2018
- Premium Statistic Mexico: housing price in Greater Mexico City 2013-2018
- Premium Statistic Mexico: housing price in Greater Monterrey 2013-2018
- Premium Statistic Household spending on water supply and other services in Poland 2022-20
- Basic Statistic Households overburdened by housing costs Europe and the UK 2015, by tenure
- Basic Statistic Percentage of households at risk of poverty overburdened by housing costs EU & UK
- Premium Statistic Share of homeowner equity in real estate in the U.S. 1960-2022
- Premium Statistic Share of households renting homes Japan 2014-2023
About the region
10
- Premium Statistic Chile: household expenditure per category 2016
- Premium Statistic Chile: household consumption expenditure 2012-2022
- Premium Statistic Chile: distribution of household income 2016, by employment
- Premium Statistic Chile: distribution of household income 2016
- Premium Statistic Chile: distribution of household income 2016, by residence
- Premium Statistic Chile: distribution of household income 2016, by age
- Premium Statistic Chile: distribution of household income 2016, by education level
- Premium Statistic HIV expenditure in Chile 2010-2022
- Basic Statistic Ratio of military expenditure to gross domestic product (GDP) in Chile 2022
- Basic Statistic Ratio of government expenditure to gross domestic product (GDP) in Chile 2029
Other regions
10
- Premium Statistic Average weekly household alcohol & tobacco expenditure England (UK) 2018 by region
- Premium Statistic Average weekly household expenditure on clothing and footwear UK 2001-2022
- Basic Statistic Household debt service payments as a share of disposable income in the U.S. 2011-2023
- Premium Statistic Average weekly household expenditure in Northern Ireland 2021, by category
- Premium Statistic Household consumption volume index in the Netherlands 1995-2017
- Premium Statistic Household products sales value in selected European countries 2014/15
- Basic Statistic Opinion about financial situation of household in Luxembourg in 2019
- Premium Statistic Household cleaning products: Quarterly sales value in Germany 2014/15
- Premium Statistic Household spending in Iraq from 1993 to 2012, by item
- Basic Statistic Average monthly food and non-food consumption per adult in Tanzania 2017-2018
Related statistics
10
- Basic Statistic Average housing costs for homeowners in the Netherlands 2009, 2012, 2018, by province
- Basic Statistic Average total of housing costs in the Netherlands 2012, 2015 and 2018, by province
- Basic Statistic Volume of homeowner equity in the U.S. 1960-2022
- Basic Statistic Hourly wages needed to afford a two-bedroom apartment in the U.S. 2023, by state
- Premium Statistic Share of adults that own their home outright in the United Kingdom (UK) 2020, by age
- Premium Statistic Share of adults with a mortgage in the UK 2022, by age
- Premium Statistic Individuals struggling to pay rent in Italy 2019, by geographical area
- Premium Statistic Individuals struggling to pay mortgage instalments in Italy 2017-2019
- Premium Statistic Individuals struggling to pay mortgage instalments in Italy 2017-2019, by area
- Premium Statistic Individuals struggling to pay rent in Italy 2017-2019
Further related statistics
9
- Ethical personal products: spending in the United Kingdom (UK) 2011-2021
- Japan: IT spending 2005-2014
- Footwear retail sales volume trend in Great Britain (UK) 2008-2022
- Net sales of GameStop worldwide 2010-2022, by region
- Main modes of access to books in France 2023
- Net sales of Dick's Sporting Goods U.S. 2006-2023
- Sales share of L'Oréal's global cosmetic branch 2022, by geographic zone
- Employee compensation and benefits at Deutsche Bank 2006-2022
- The adidas Group's global footwear production from 2008-2023
Further Content: You might find this interesting as well
Statistics
- Ethical personal products: spending in the United Kingdom (UK) 2011-2021
- Japan: IT spending 2005-2014
- Footwear retail sales volume trend in Great Britain (UK) 2008-2022
- Net sales of GameStop worldwide 2010-2022, by region
- Main modes of access to books in France 2023
- Net sales of Dick's Sporting Goods U.S. 2006-2023
- Sales share of L'Oréal's global cosmetic branch 2022, by geographic zone
- Employee compensation and benefits at Deutsche Bank 2006-2022
- The adidas Group's global footwear production from 2008-2023
Banco Central de Chile. (May 2, 2022). Number of new housing units sold in Chile from 2014 to 2021 (in 1,000s) [Graph]. In Statista. Retrieved April 27, 2024, from https://www.statista.com/statistics/831283/number-new-housing-units-sold-chile/
Banco Central de Chile. "Number of new housing units sold in Chile from 2014 to 2021 (in 1,000s)." Chart. May 2, 2022. Statista. Accessed April 27, 2024. https://www.statista.com/statistics/831283/number-new-housing-units-sold-chile/
Banco Central de Chile. (2022). Number of new housing units sold in Chile from 2014 to 2021 (in 1,000s). Statista. Statista Inc.. Accessed: April 27, 2024. https://www.statista.com/statistics/831283/number-new-housing-units-sold-chile/
Banco Central de Chile. "Number of New Housing Units Sold in Chile from 2014 to 2021 (in 1,000s)." Statista, Statista Inc., 2 May 2022, https://www.statista.com/statistics/831283/number-new-housing-units-sold-chile/
Banco Central de Chile, Number of new housing units sold in Chile from 2014 to 2021 (in 1,000s) Statista, https://www.statista.com/statistics/831283/number-new-housing-units-sold-chile/ (last visited April 27, 2024)
Number of new housing units sold in Chile from 2014 to 2021 (in 1,000s) [Graph], Banco Central de Chile, May 2, 2022. [Online]. Available: https://www.statista.com/statistics/831283/number-new-housing-units-sold-chile/