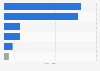
This statistic depicts the global demand for platinum and palladium for chemical applications worldwide by region in 2018. In that year, the demand for palladium for the chemical industry reached 66,000 ounces in North America. Palladium is often used as a part of catalytic converters which is involved in the conversion of the harmful substances in automotive exhaust into less harmful substances. Platinum is one of the least reactive metals in the world and is highly resistant to corrosion. It is often used as a catalyst or as a precious metal.
Global platinum and palladium demand for chemical applications by region in 2018 (in 1,000 ounces)*
Basic Account
Get to know the platform
You only have access to basic statistics.
This statistic is not included in your account.
Starter Account
The ideal entry-level account for individual users
- Instant access to 1m statistics
- Download in XLS, PDF & PNG format
- Detailed references
$199 USD / Month *
Professional Account
Full access
Business Solutions including all features.
* Prices do not include sales tax.
Other statistics that may interest you Statistics on
About the industry
9
- Premium Statistic Global palladium demand 2021-2023, by region
- Premium Statistic Worldwide dental demand for palladium by region 2013-2018
- Premium Statistic Worldwide petroleum demand for platinum by region 2013-2018
- Premium Statistic Worldwide supply of platinum 2005-2023
- Premium Statistic Global demand for platinum 2005-2023
- Premium Statistic Worldwide demand for platinum by region 2019-2023
- Premium Statistic Worldwide supply of palladium 2013-2023
- Premium Statistic Average cost of platinum production by region 2013-2018
- Premium Statistic Cash costs plus capex platinum production by region 2016-2018
About the region
10
- Premium Statistic Worldwide glass demand for platinum by region 2013-2018
- Basic Statistic Annual price of platinum by major currency 2013-2014
- Premium Statistic Global palladium demand volume 2014-2023
- Premium Statistic Global mine production of platinum-group metals 2010-2022
- Premium Statistic Global platinum demand for jewelry by region 2015-2023
- Premium Statistic Rio Tinto's gold and silver production 2010-2023
- Premium Statistic Global leading exporting countries of palladium 2022
- Basic Statistic Nornickel's palladium production 2010-2023
- Premium Statistic Norilsk Nickel's platinum production 2010-2023
- Premium Statistic Goldcorp's silver production 2010-2018
Selected statistics
4
Other regions
10
- Premium Statistic Value of U.S. mine production of platinum 2010-2022
- Premium Statistic Share of gold production in Canada 2022, by region
- Premium Statistic Mexico: silver mine production in ounces 2012-2023
- Premium Statistic Platinum mine production in South Africa 2010-2023
- Premium Statistic North American platinum production 2010-2019
- Premium Statistic North American palladium production 2010-2019
- Premium Statistic Platinum demand China 2013-2023
- Premium Statistic Chile: FDI in mining sector 2010-2015
- Premium Statistic Umicore's expenditure on research and development (R&D) in 2012-2020
- Premium Statistic Ireland: monthly value of precious metal imports 2017
Related statistics
10
- Premium Statistic U.S. platinum refinery production volume 2010-2022
- Basic Statistic U.S. platinum refinery production value 2010-2021
- Premium Statistic Platinum mine production in the U.S. 2010-2023
- Premium Statistic U.S. import volume of platinum 2014-2022
- Basic Statistic U.S. refined platinum export volume 2010-2022
- Premium Statistic Gold reserves in Canada 1980-2019
- Premium Statistic Silver reserves in Canada 1980-2019
- Premium Statistic Global germanium refinery production 2021, by country
- Premium Statistic Mine closures in Canada by mine type 2006-2015
- Basic Statistic Palladium production in South Africa 2010-2023
Further related statistics
9
- Rio Tinto's aluminum and copper production 2010-2023
- Number of Rio Tinto's employees 2010-2023
- Freeport-McMoRan's copper production 2010-2023
- Molycorp's revenue 2008-2014
- Rio Tinto's net income 2005-2023
- Comparison of cobalt consumption in the U.S. 2010-2023
- Iron ore prices 2000-2022
- Thermal coal prices 2013-2022
- Rio Tinto's diamond production 2010-2023
Further Content: You might find this interesting as well
Statistics
- Rio Tinto's aluminum and copper production 2010-2023
- Number of Rio Tinto's employees 2010-2023
- Freeport-McMoRan's copper production 2010-2023
- Molycorp's revenue 2008-2014
- Rio Tinto's net income 2005-2023
- Comparison of cobalt consumption in the U.S. 2010-2023
- Iron ore prices 2000-2022
- Thermal coal prices 2013-2022
- Rio Tinto's diamond production 2010-2023
GFMS, & Thomson Reuters. (May 31, 2019). Global platinum and palladium demand for chemical applications by region in 2018 (in 1,000 ounces)* [Graph]. In Statista. Retrieved May 16, 2024, from https://www.statista.com/statistics/418260/global-platinum-and-palladium-demand-for-chemical-applications-by-region/
GFMS, und Thomson Reuters. "Global platinum and palladium demand for chemical applications by region in 2018 (in 1,000 ounces)*." Chart. May 31, 2019. Statista. Accessed May 16, 2024. https://www.statista.com/statistics/418260/global-platinum-and-palladium-demand-for-chemical-applications-by-region/
GFMS, Thomson Reuters. (2019). Global platinum and palladium demand for chemical applications by region in 2018 (in 1,000 ounces)*. Statista. Statista Inc.. Accessed: May 16, 2024. https://www.statista.com/statistics/418260/global-platinum-and-palladium-demand-for-chemical-applications-by-region/
GFMS, and Thomson Reuters. "Global Platinum and Palladium Demand for Chemical Applications by Region in 2018 (in 1,000 Ounces)*." Statista, Statista Inc., 31 May 2019, https://www.statista.com/statistics/418260/global-platinum-and-palladium-demand-for-chemical-applications-by-region/
GFMS & Thomson Reuters, Global platinum and palladium demand for chemical applications by region in 2018 (in 1,000 ounces)* Statista, https://www.statista.com/statistics/418260/global-platinum-and-palladium-demand-for-chemical-applications-by-region/ (last visited May 16, 2024)
Global platinum and palladium demand for chemical applications by region in 2018 (in 1,000 ounces)* [Graph], GFMS, & Thomson Reuters, May 31, 2019. [Online]. Available: https://www.statista.com/statistics/418260/global-platinum-and-palladium-demand-for-chemical-applications-by-region/