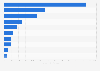
This statistic shows average annual expenditure on miscellaneous household products per consumer unit in the United States from 2007 to 2022. In 2022, the country's average expenditure on miscellaneous household products amounted to 246.89 U.S. dollars per consumer unit.
Average annual expenditure on miscellaneous household products per consumer unit in the United States from 2007 to 2022 (in U.S. dollars)
Loading statistic...
Basic Account
Get to know the platform
You only have access to basic statistics.
Starter Account
The ideal entry-level account for individual users
- Instant access to 1m statistics
- Download in XLS, PDF & PNG format
- Detailed references
$199 USD / Month *
Professional Account
Full access
Business Solutions including all features.
* Prices do not include sales tax.
Other statistics that may interest you Statistics on
About the industry
10
- Basic Statistic U.S. household expenditure on other household products 2007-2022
- Premium Statistic U.S. household expenditure on laundry and cleaning supplies 2007-2022
- Basic Statistic U.S. household expenditure on postage and stationery 2007-2022
- Basic Statistic U.S. household expenditure on housekeeping supplies 2007-2022
- Basic Statistic U.S. household expenditure on dishwashers, garbage disposals, range hoods 2007-2021
- Basic Statistic U.S. household expenditure on refrigerators and freezers (renter) 2007-2021
- Basic Statistic U.S. household expenditure on non-electric cookware 2007-2022
- Basic Statistic U.S. household expenditure on tableware, non-electric kitchenware 2007-2022
- Basic Statistic U.S. household expenditure on stationery, stationery supplies, giftwrap 2007-2022
- Basic Statistic U.S. household expenditure on flatware 2007-2022
About the region
10
- Basic Statistic U.S. household expenditure on soaps and detergents 2007-2022
- Basic Statistic U.S. household expenditure on cleansing, toilet tissue, paper towels, napkins 2022
- Basic Statistic U.S. household expenditure on other laundry cleaning products 2007-2022
- Basic Statistic U.S. household expenditure on electric floor cleaning equipment 2007-2019
- Basic Statistic U.S. household expenditure on delivery services 2007-2022
- Basic Statistic U.S. household expenditure on bathroom linens 2007-2022
- Premium Statistic U.S. household expenditure on cosmetics, perfume and bath products 2010-2022
- Premium Statistic U.S. household expenditure on hair care products 2010-2022
- Basic Statistic U.S. household expenditure on portable dishwashers (owned home) 2007-2021
- Basic Statistic U.S. household expenditure on portable dishwashers (renter) 2007-2021
Other regions
10
- Basic Statistic Canada: average annual household expenditure in 2017 by province
- Premium Statistic Share of urban buyers purchasing toilet cleaners in Vietnam 2015-2019
- Premium Statistic Household income & expenditure Brazil 2015-2017
- Basic Statistic Revenue of the Unilever Group worldwide 2023, by product segment
- Premium Statistic Production volume of creams and lotions in India FY 2015-2021
- Premium Statistic Household goods and services: Weekly expenditure in United Kingdom (UK) 2022, by age
- Basic Statistic Annual average household spending in Belgium in 2020, by size of household
- Premium Statistic Grocery spending of the UAE 2011-2015
- Premium Statistic Average monthly household expenditure in Saudi Arabia 2018
- Premium Statistic Person responsible for cleaning in households in selected European countries 2019
Related statistics
10
- Basic Statistic U.S. household expenditure on slipcovers and decorative pillows 2007-2022
- Basic Statistic U.S. household expenditure on outdoor furniture 2007-2022
- Basic Statistic U.S. household expenditure on sewing materials 2015 to 2022
- Basic Statistic U.S. household expenditure on wall units, cabinets, and other furniture 2007-2022
- Basic Statistic U.S. household expenditure on furniture 2007-2022
- Basic Statistic U.S. household expenditure on mattresses and springs 2007-2022
- Basic Statistic U.S. household expenditure on lawn and garden supplies 2007-2022
- Basic Statistic U.S. household expenditure on sewing machines 2007-2021
- Basic Statistic U.S. household expenditure on household furnishings and equipment 2007-2022
- Basic Statistic U.S. household expenditure on sofas 2007-2022
Further related statistics
10
- Mondelez International's net revenue distribution worldwide by sector 2022
- Mondelez International's operating income worldwide 2011-2022
- Mondelez International's global workforce by region 2012-2022
- Employee compensation and benefits at Deutsche Bank 2006-2022
- Global advertising expenditure of Colgate-Palmolive 2009-2023
- Walgreens gross profit and net earnings in the U.S. 2005-2023
- Number of TV households in the UK 2013-2022
- Global advertising costs of The Clorox Company 2011-2023
- Net sales of ConAgra Brands worldwide 2012-2023
- Net sales of ConAgra Brands worldwide 2015-2023, by segment
Further Content: You might find this interesting as well
Statistics
- Mondelez International's net revenue distribution worldwide by sector 2022
- Mondelez International's operating income worldwide 2011-2022
- Mondelez International's global workforce by region 2012-2022
- Employee compensation and benefits at Deutsche Bank 2006-2022
- Global advertising expenditure of Colgate-Palmolive 2009-2023
- Walgreens gross profit and net earnings in the U.S. 2005-2023
- Number of TV households in the UK 2013-2022
- Global advertising costs of The Clorox Company 2011-2023
- Net sales of ConAgra Brands worldwide 2012-2023
- Net sales of ConAgra Brands worldwide 2015-2023, by segment
Bureau of Labor Statistics. (September 8, 2023). Average annual expenditure on miscellaneous household products per consumer unit in the United States from 2007 to 2022 (in U.S. dollars) [Graph]. In Statista. Retrieved May 15, 2024, from https://www.statista.com/statistics/305518/us-expenditure-on-miscellaneous-household-products/
Bureau of Labor Statistics. "Average annual expenditure on miscellaneous household products per consumer unit in the United States from 2007 to 2022 (in U.S. dollars)." Chart. September 8, 2023. Statista. Accessed May 15, 2024. https://www.statista.com/statistics/305518/us-expenditure-on-miscellaneous-household-products/
Bureau of Labor Statistics. (2023). Average annual expenditure on miscellaneous household products per consumer unit in the United States from 2007 to 2022 (in U.S. dollars). Statista. Statista Inc.. Accessed: May 15, 2024. https://www.statista.com/statistics/305518/us-expenditure-on-miscellaneous-household-products/
Bureau of Labor Statistics. "Average Annual Expenditure on Miscellaneous Household Products per Consumer Unit in The United States from 2007 to 2022 (in U.S. Dollars)." Statista, Statista Inc., 8 Sep 2023, https://www.statista.com/statistics/305518/us-expenditure-on-miscellaneous-household-products/
Bureau of Labor Statistics, Average annual expenditure on miscellaneous household products per consumer unit in the United States from 2007 to 2022 (in U.S. dollars) Statista, https://www.statista.com/statistics/305518/us-expenditure-on-miscellaneous-household-products/ (last visited May 15, 2024)
Average annual expenditure on miscellaneous household products per consumer unit in the United States from 2007 to 2022 (in U.S. dollars) [Graph], Bureau of Labor Statistics, September 8, 2023. [Online]. Available: https://www.statista.com/statistics/305518/us-expenditure-on-miscellaneous-household-products/