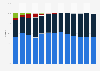
Frequency of unsolicited calls to mobile phones in Australia 2018 by type

Frequency of unsolicited telephone calls to mobile phones in Australia in 2018, by type

Download
Show detailed source information?
Register for free
Already a member?
Log in
Source

Use Ask Statista Research Service

Release date

December 2018

Region

Australia

Survey time period

February 6, 2018 to April 4, 2018

Age group

18 years and older

Special properties

survey had different stages; dates stated are from the beginning of the first stage to the end of the last stage

Method of interview

Face-to-face interviews, telephone interviews

Supplementary notes

According to the source: Refused responses excluded from base for calculation. Don’t know responses not displayed (<5%) for each statement. Data may not add up to 100 per cent due to rounding.

Base:
Telemarketing (n=748),
Charities (n=511),
Education (n=73),
Social or market research (n=413),
Political (n=188),
Government (n=119),
Scam (n=677).

Citation formats
Statista Accounts: Access All Statistics. Starting from $2,388 USD / Year
Basic Account
Get to know the platform

You only have access to basic statistics.
This statistic is not included in your account.

Starter Account
The ideal entry-level account for individual users
  • Instant access to 1m statistics
  • Download in XLS, PDF & PNG format
  • Detailed references
$199 USD / Month *
Professional Account
Full access

Business Solutions including all features.

* Prices do not include sales tax.

Statistics on " Smartphone market in Australia "

Other statistics that may interest you Smartphone market in Australia

Global overview

5

National overview

5

Smartphone brands and operators

6

Mobile internet and payments

5

Mobile apps

6

Further related statistics

10
Statista Accounts: Access All Statistics. Starting from $2,388 USD / Year
Learn more about how Statista can support your business.