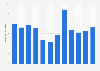
Volume in the Non-Alcoholic Drinks market Indonesia 2014-2027
The volume is forecast to experience significant growth in all segments in 2027. As part of the positive trend, the volume reaches the maximum value for all four different segments at the end of the comparison period. Particularly noteworthy is the segment Bottled Water, which has the highest value of 26.9 billion litres.
Find further similar statistics regarding the non-alcoholic drinks market in countries or regions like India, Germany, and Russia.
Find further similar statistics regarding the non-alcoholic drinks market in countries or regions like India, Germany, and Russia.